 By
By 🏡 March Market Report – Irlam, Cadishead & Rixton By your Local Property Investigator, Oliver James As Q1 draws to a close, the property market across Irlam, Cadishead, and Rixton is painting a picture of resilience, recovery, and renewed momentum. Traditionally, March brings a mixture of seasonal shifts: motivated buyers making moves before the Easter holidays, and sellers weighing up whether to list before the spring rush or hold off until the weather (and gardens!) improve. But this March felt different. Conversations with fellow estate agents up and down the country suggest a busy few months — driven partly by whispers of stamp duty changes, partly by improved buyer confidence, and partly by homeowners recognising that sitting still might cost them more in the long run.
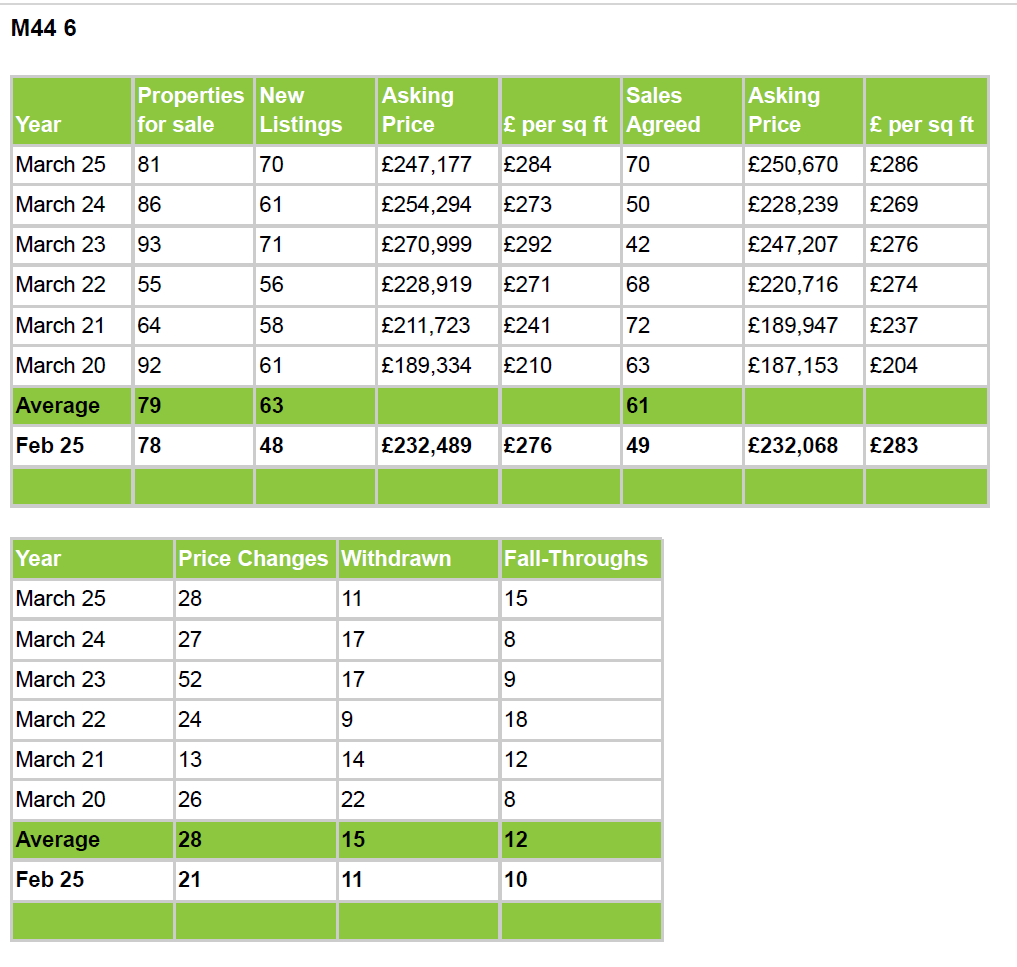
So how did the market perform in detail?
🔎 Cadishead – Low Supply, High Intent
In Cadishead, supply is noticeably down — with 25% fewer properties available than this time last year. That might sound like cause for concern, but it’s actually creating opportunity. Less choice means more competition, and we’ve seen a 25.8% increase in sales agreed since February, suggesting that buyers are ready to commit quickly when the right home appears.
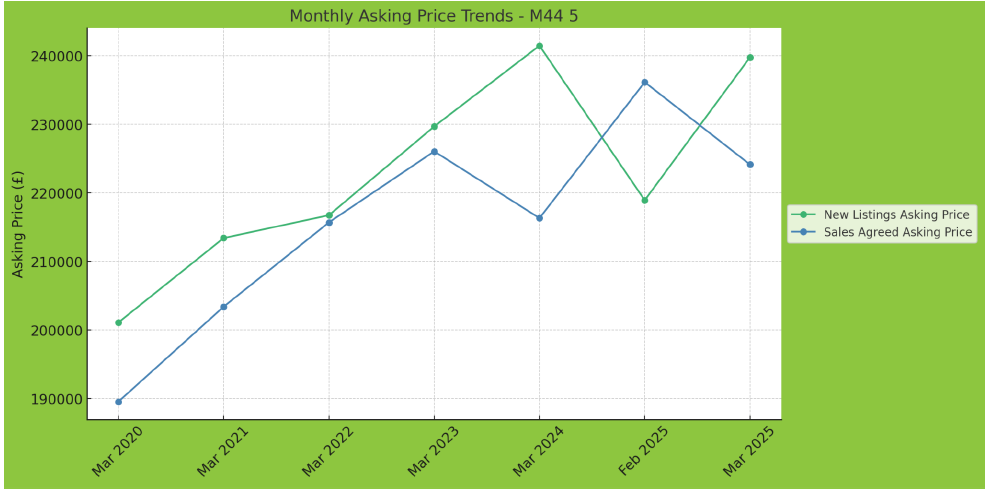
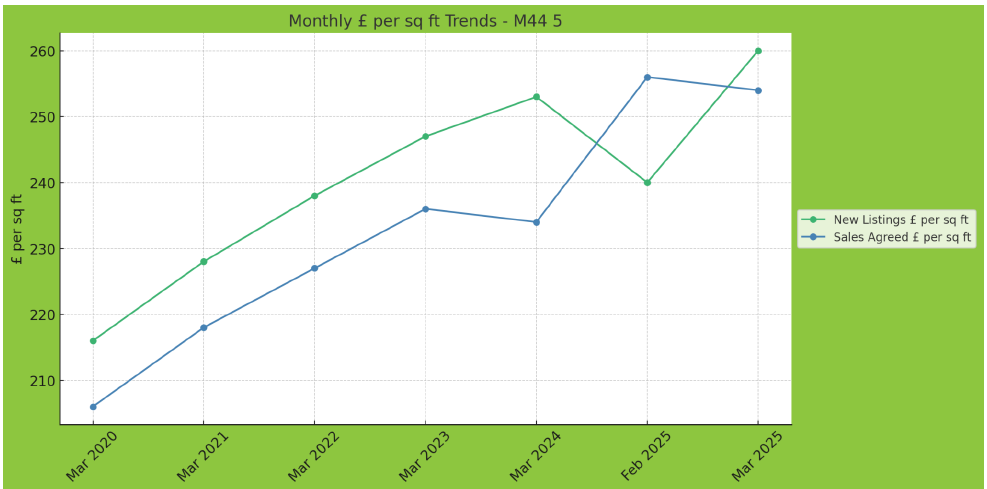
New listings were flat year-on-year but did see a sharp month-on-month rise (+63%), indicating that sellers are beginning to respond to market demand. Importantly, sale prices per square foot rose by 8.55% annually, and price changes on listings were up 16.7% in just one month — a strong signal that confidence is returning.
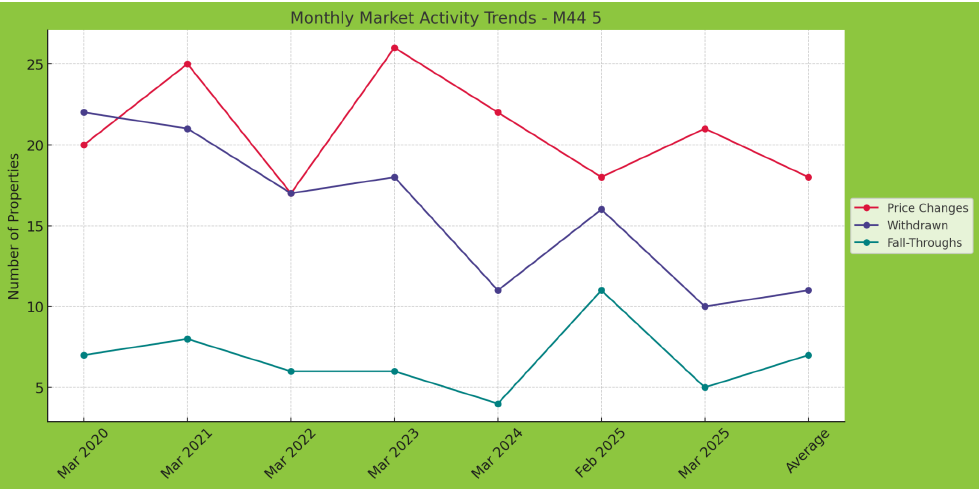
Fall-throughs also dropped dramatically in March, down more than 50% from February. This suggests buyers are more committed and better prepared — a likely result of more proactive mortgage work and clearer communication from agents.

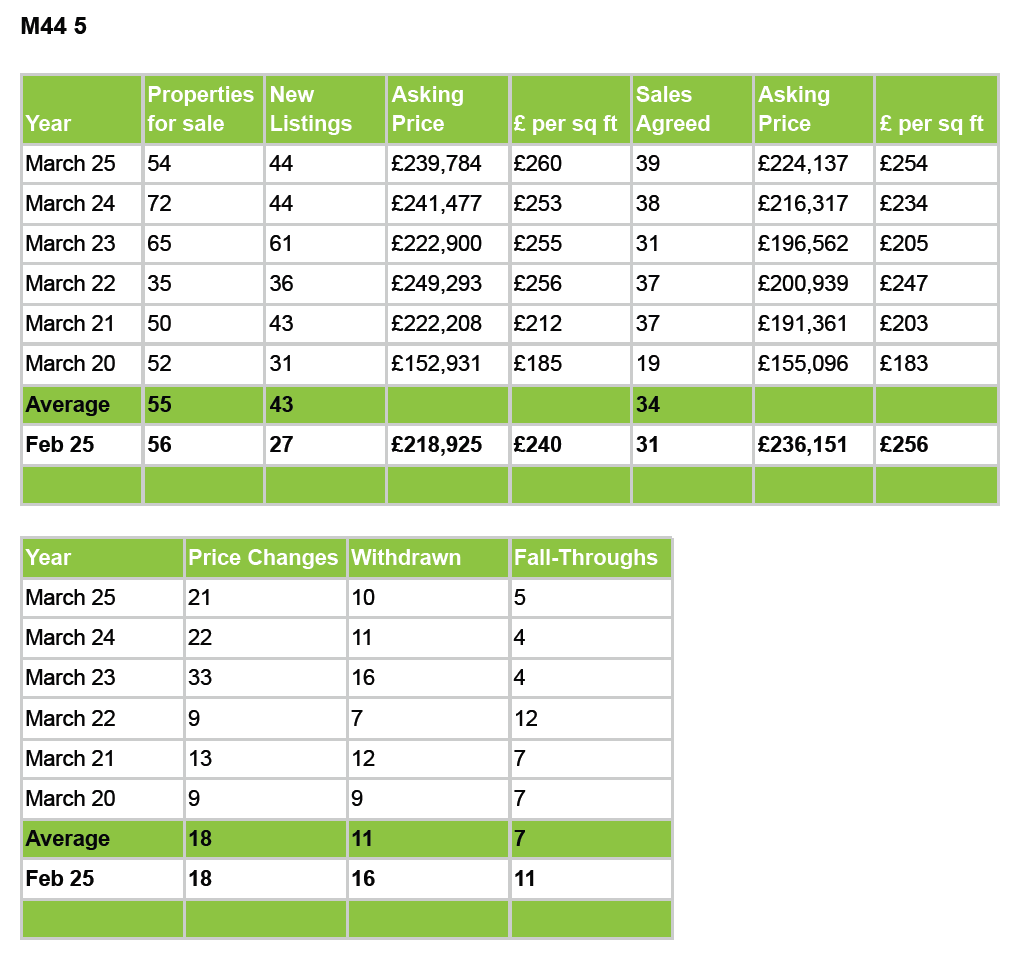
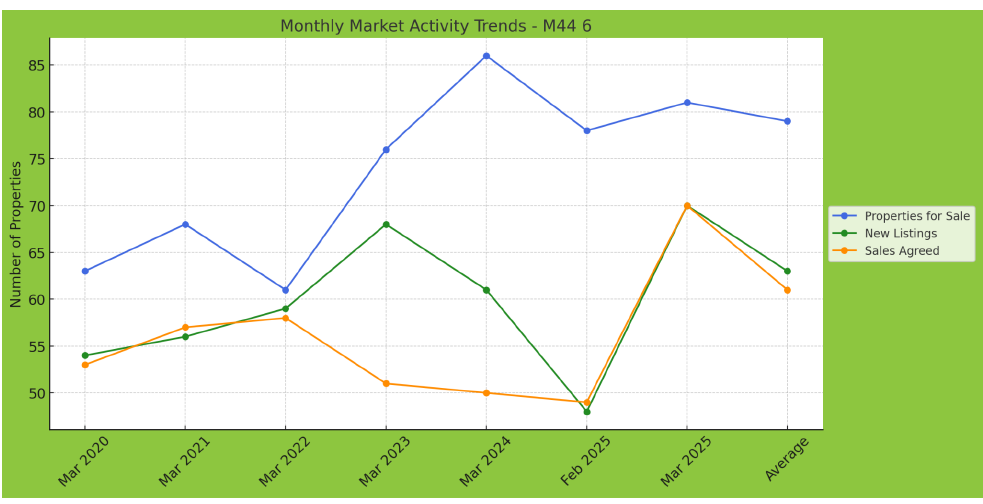
🏡 Activity Metrics
1. Properties for Sale
● March 2024 → March 2025: -25.00%
● February 2025 → March 2025: -3.57%
● March 2025 vs Average: -1.82%
2. New Listings
● March 2024 → March 2025: 0.00%
● February 2025 → March 2025: +62.96%
● March 2025 vs Average: +2.33%
3. Sales Agreed
● March 2024 → March 2025: +2.63%
● February 2025 → March 2025: +25.81%
● March 2025 vs Average: +14.71%
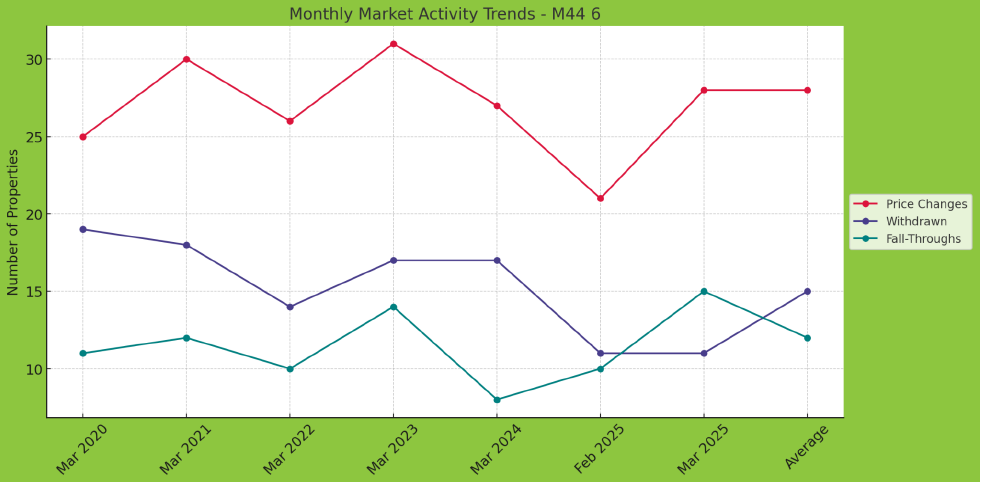
4. Price Changes
● March 2024 → March 2025: -4.55%
● February 2025 → March 2025: +16.67%
● March 2025 vs Average: +16.67%
5. Withdrawn
● March 2024 → March 2025: -9.09%
● February 2025 → March 2025: -37.50%
● March 2025 vs Average: -9.09%
6. Fall-Throughs
● March 2024 → March 2025: +25.00%
● February 2025 → March 2025: -54.55%
● March 2025 vs Average: -28.57%
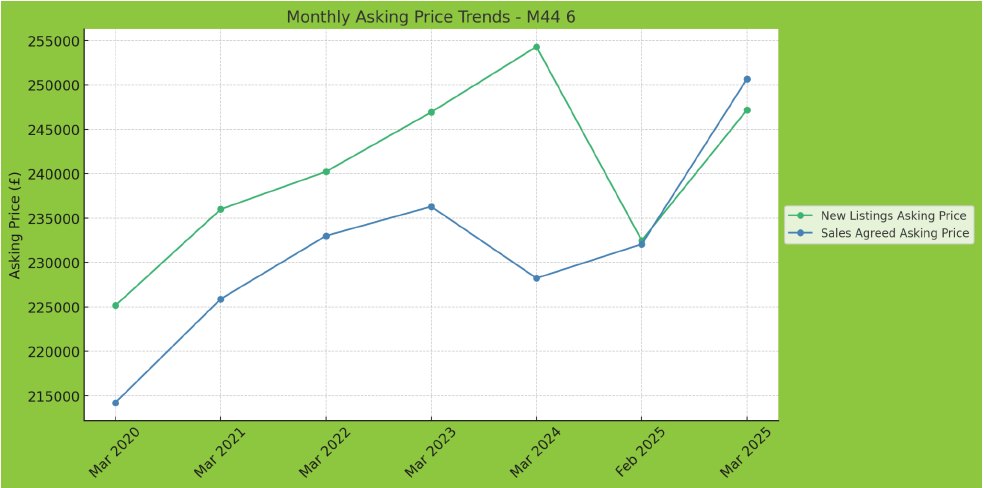
💷 Asking Prices
7. New Listings Asking Price
● March 2024 → March 2025: -0.70%
● February 2025 → March 2025: +9.53%
8. Sales Agreed Asking Price
● March 2024 → March 2025: +3.61%
● February 2025 → March 2025: -5.12%
📏 Price per Square Foot (£/sq ft)
9. New Listings £ per sq ft
● March 2024 → March 2025: +2.77%
● February 2025 → March 2025: +8.33%
10. Sales Agreed £ per sq ft
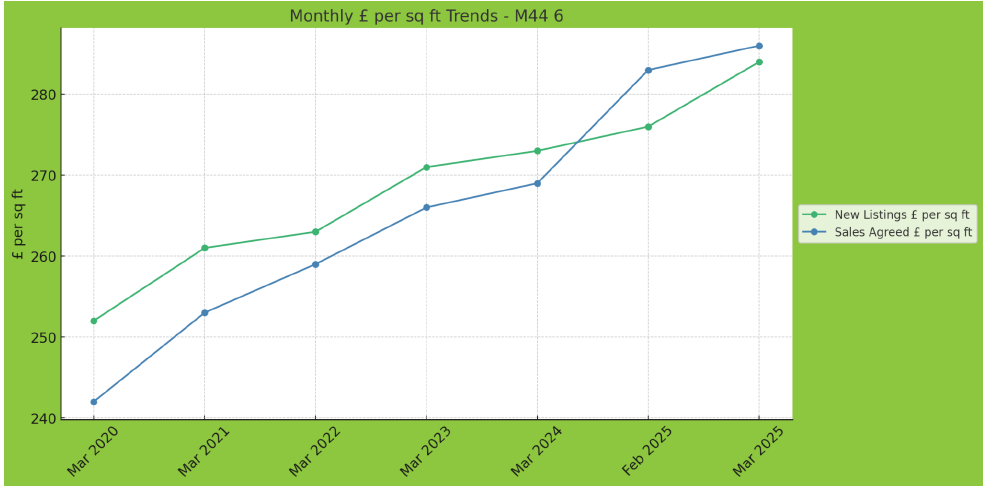
● March 2024 → March 2025: +8.55%
● February 2025 → March 2025: -0.78%
🌟 Irlam – A Surge in Activity
Irlam was the standout performer this month. New listings increased by nearly 46% from February and are up 15% year-on-year. Sales agreed rose 40% compared to March 2024, and a staggering 43% compared to February 2025. This level of activity is rare and noteworthy — it speaks to a market that’s not just alive, but thriving.
Asking prices for sales agreed are also up nearly 10% annually, and price per square foot for agreed sales rose 6.3%, showing that buyer enthusiasm is being matched by willingness to meet seller expectations.
However, not everything is rosy: fall-throughs rose sharply year-on-year (+87.5%). This could be down to overly optimistic offers, delayed mortgage approvals, or issues uncovered during surveys. But with withdrawal rates falling and price changes rising, the overall tone in Irlam remains very positive.
🏡 Activity Metrics
1. Properties for Sale
● March 2024 → March 2025: -5.81%
● February 2025 → March 2025: +3.85%
● March 2025 vs Average: +2.53%
2. New Listings
● March 2024 → March 2025: +14.75%
● February 2025 → March 2025: +45.83%
● March 2025 vs Average: +11.11%
3. Sales Agreed
● March 2024 → March 2025: +40.00%
● February 2025 → March 2025: +42.86%
● March 2025 vs Average: +14.75%
4. Price Changes
● March 2024 → March 2025: +3.70%
● February 2025 → March 2025: +33.33%
● March 2025 vs Average: 0.00%
5. Withdrawn
● March 2024 → March 2025: -35.29%
● February 2025 → March 2025: 0.00%
● March 2025 vs Average: -26.67%
6. Fall-Throughs
● March 2024 → March 2025: +87.50%
● February 2025 → March 2025: +50.00%
● March 2025 vs Average: +25.00%
💷 Asking Prices
7. New Listings Asking Price
● March 2024 → March 2025: -2.80%
● February 2025 → March 2025: +6.29%
8. Sales Agreed Asking Price
● March 2024 → March 2025: +9.83%
● February 2025 → March 2025: +8.00%
📏 Price per Square Foot (£/sq ft)
9. New Listings £ per sq ft
● March 2024 → March 2025: +4.03%
● February 2025 → March 2025: +2.90%
10. Sales Agreed £ per sq ft
● March 2024 → March 2025: +6.32%
● February 2025 → March 2025: +1.06%
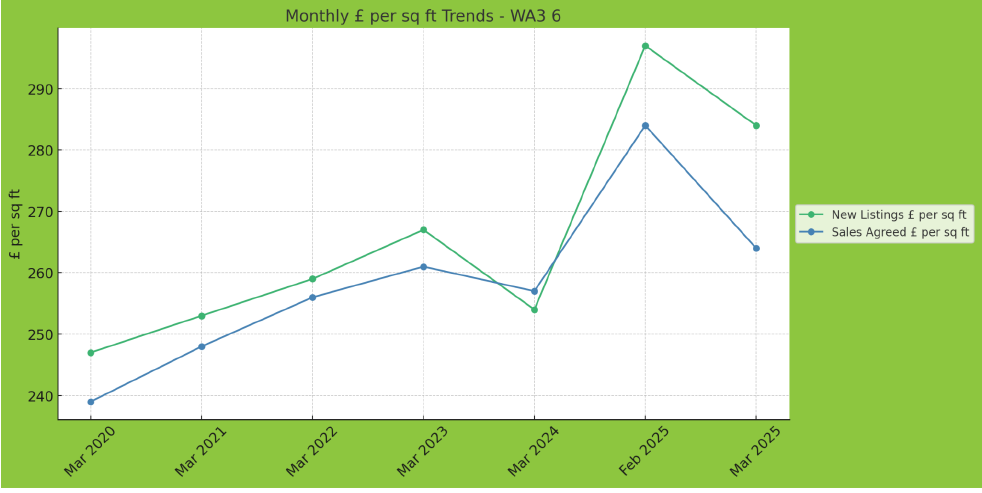
🌾 Rixton and Lowton WA3 6 – A Tight but Valuable Market
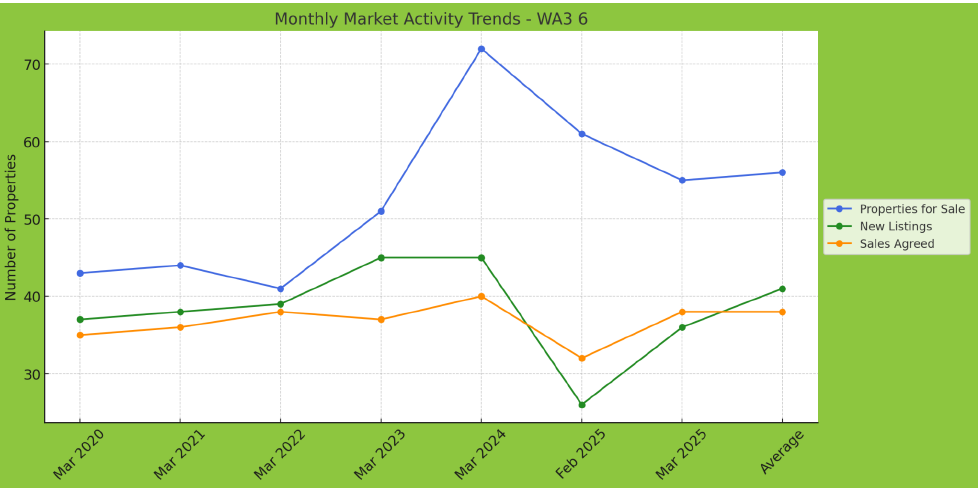
Rixton's numbers require a more nuanced reading. Stock is down substantially, with a 23.6% annual drop in properties for sale and 20% fewer new listings year-on-year. On paper, this suggests a quieter market — but look closer, and the story is more complex.
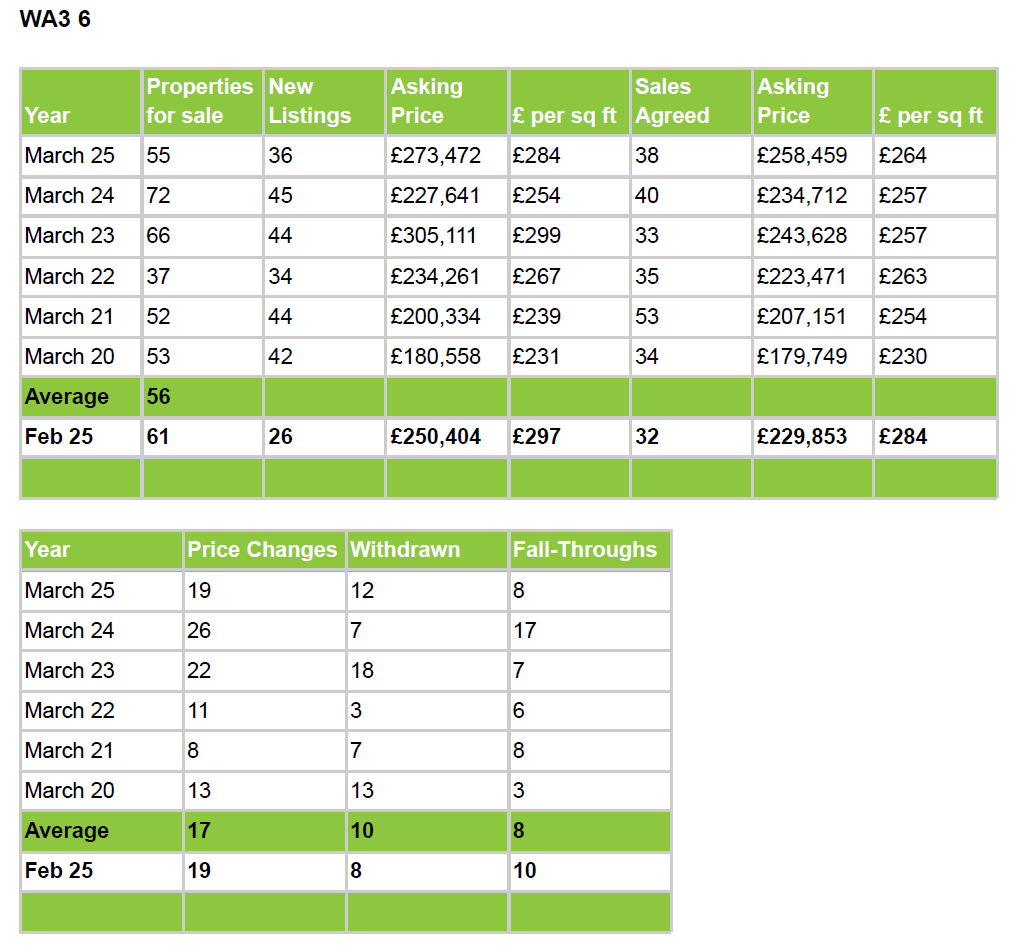
Despite reduced supply, sales agreed rose 18.75% month-on-month. Sellers are holding back, but buyers are ready — and they’re paying more. Asking prices for new listings were up 20% compared to March 2024, and prices agreed rose by over 10%.
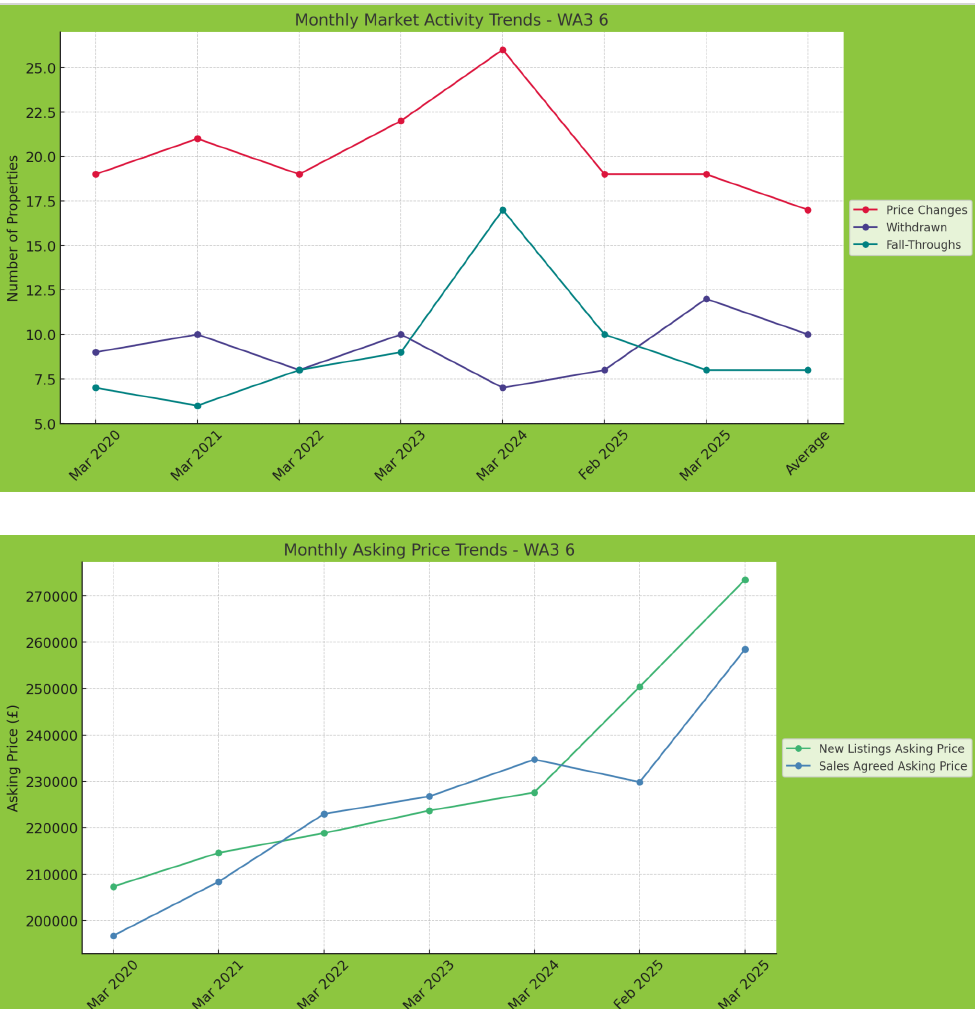
That said, we did see a drop in the average price per square foot for March sales (-7%), which could reflect a shift in the type of property being sold — possibly more mid-range homes entering the mix. Withdrawals and fall-throughs were both higher than average, which suggests that expectations between buyers and sellers aren’t always aligned. This is where a skilled agent becomes crucial to keep deals on track.
🏡 Activity Metrics
1. Properties for Sale
● March 2024 → March 2025: -23.61%
● February 2025 → March 2025: -9.84%
● March 2025 vs Average: -1.79%
2. New Listings
● March 2024 → March 2025: -20.00%
● February 2025 → March 2025: +38.46%
● March 2025 vs Average: -12.20%
3. Sales Agreed
● March 2024 → March 2025: -5.00%
● February 2025 → March 2025: +18.75%
● March 2025 vs Average: 0.00%
4. Price Changes
● March 2024 → March 2025: -26.92%
● February 2025 → March 2025: 0.00%
● March 2025 vs Average: +11.76%
5. Withdrawn
● March 2024 → March 2025: +71.43%
● February 2025 → March 2025: +50.00%
● March 2025 vs Average: +20.00%
6. Fall-Throughs
● March 2024 → March 2025: -52.94%
● February 2025 → March 2025: -20.00%
● March 2025 vs Average: 0.00%
💷 Asking Prices
7. New Listings Asking Price
● March 2024 → March 2025: +20.12%
● February 2025 → March 2025: +9.14%
8. Sales Agreed Asking Price
● March 2024 → March 2025: +10.10%
● February 2025 → March 2025: +12.47%
📏 Price per Square Foot (£/sq ft)
9. New Listings £ per sq ft
● March 2024 → March 2025: +11.81%
● February 2025 → March 2025: -4.38%
10. Sales Agreed £ per sq ft
● March 2024 → March 2025: +2.72%
● February 2025 → March 2025: -7.04%
📊 Market Overview – Confidence with Caution
Across all three areas, the message is clear: the market is active, confident, and shifting quickly. Properties that are priced correctly and marketed professionally are selling fast — often within weeks, not months.
- Buyer demand is rising. Sales agreed are up across the board — especially in Irlam and Cadishead.
- Prices are holding strong. Asking prices and price per square foot have either held or risen.
- Supply is limited. With fewer homes on the market compared to last year, sellers are in a stronger position — particularly if their property is ready to list now.
- Fall-throughs remain a risk. It’s essential to vet buyers properly and manage chains carefully.
- Pricing Realism Pays Off: In Cadishead and Irlam, buyers are paying over the advertised £/sq ft — a sign that sensible pricing drives results.
- Supply Still a Challenge: Especially in Rixton, where limited choice and high seller expectations are making negotiations tougher.
- Eager Buyers Are Moving Quickly: But fall-throughs and chain collapses remain a risk — highlighting the value of experienced agents who can keep deals moving.
🧭 Final Thoughts – Should You Move This Spring?
With Easter behind us and the peak spring market just ahead, now is the perfect time to get your property market-ready. If you’ve been wondering whether to move in 2025, this window could offer you the best of both worlds: strong prices and motivated buyers.
I can help you prepare with photos, videos, and local buyer insights — even before you officially launch on Rightmove.
If you’d like to know what your home could be worth in today’s market, drop me a message or pop into the office for a coffee and a no-obligation chat.
Irlam property market report
Cadishead housing trends
Rixton real estate update
March 2025 property statistics
Greater Manchester house prices
Local property expert Irlam
Estate agent market analysis
Price per square foot comparison
North West property insights
Homes for sale Irlam Cadishead Rixton
Sales agreed property data
Asking vs agreed price trends
March 2025 housing market UK
Property market summary Salford
Selling your home in Irlam
How is the property market performing in


Share this with
Email
Facebook
Messenger
Twitter
Pinterest
LinkedIn
Copy this link